cspec
This document is also available as a PDF file.
Installation
To use cspec first download, compile and install
libuni. Then download, compile and install
cspec.
To build and install libuni:
  ./configure
  make
  make install
To build and install cspec:
  ./autogen.sh
  make
  make install
GTK+ programs have a lot of prerequisites but, for example, your average Linux install will most likely have most or all of it already installed. Be prepared to install a lot of software if not.
Using cspec
Once you have successfully built and installed cspec and provided you are running under a windowing systems such as X-Windows or Gnome, you can launch cspec and get started by typing:
cspec
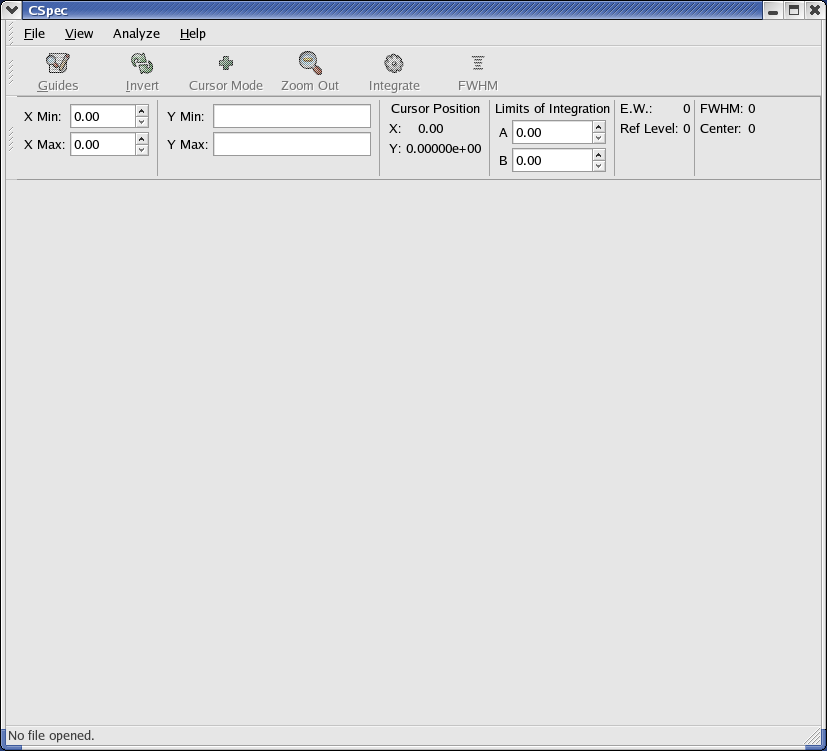
This brings up the main window:
After you launch cspec you can open an ASCII text file with X values in the first column and Y values in the second column.
This might look something like this:
9361.910    	 .441218203037526
9370.027    	 7.54761855261939E-02
9378.143    	 .175197398779006
9386.259    	 .55574663922709
9394.375    	 1.02412516528673
9402.491    	 1.34931284279343
9410.608    	 1.24309477991783
9418.724    	 1.43857453910264
...
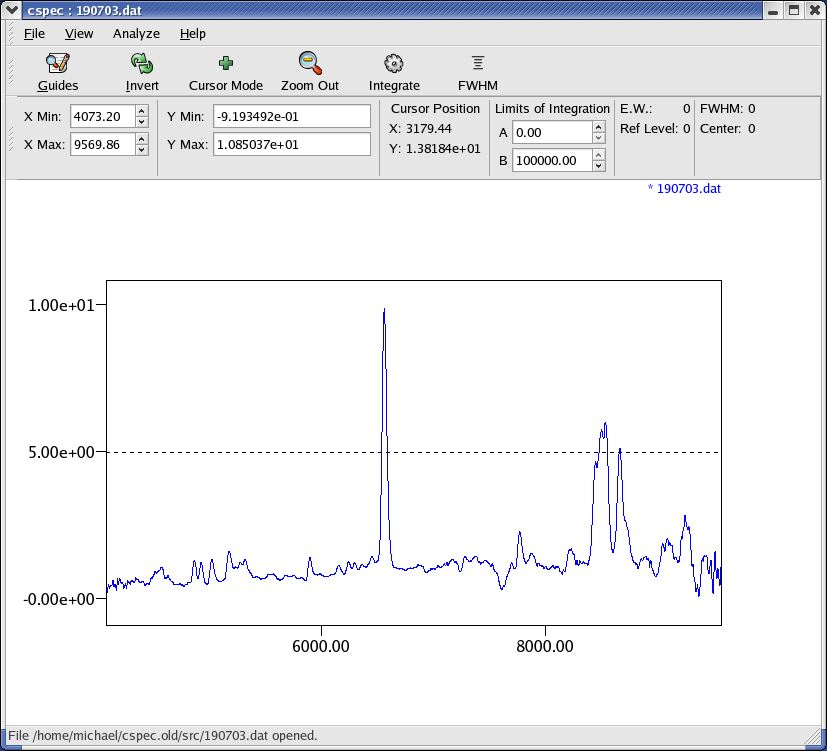
After you open a file you will see the plot of the spectrum:
As you move the cursor over the plot window the display will show you the X and Y coordinates of the current cursor position. You zoom in an an area by holding down the left mouse button and dragging. Unzoom by clicking the zoom out button in the toolbar.
Most of the standard features are self-explanatory, in regards to opening, closing and exporting the plot image. There is a help window which shows the available commands.
When you start the program a log file is created and/or appended to called log.txt. This file is in the current working directory where you launch the program.
If you have more than one spectrum open, the currently active spectrum is marked with an asterisks (*). You can change which spectrum is active by repeatedly pressing the Tab key.
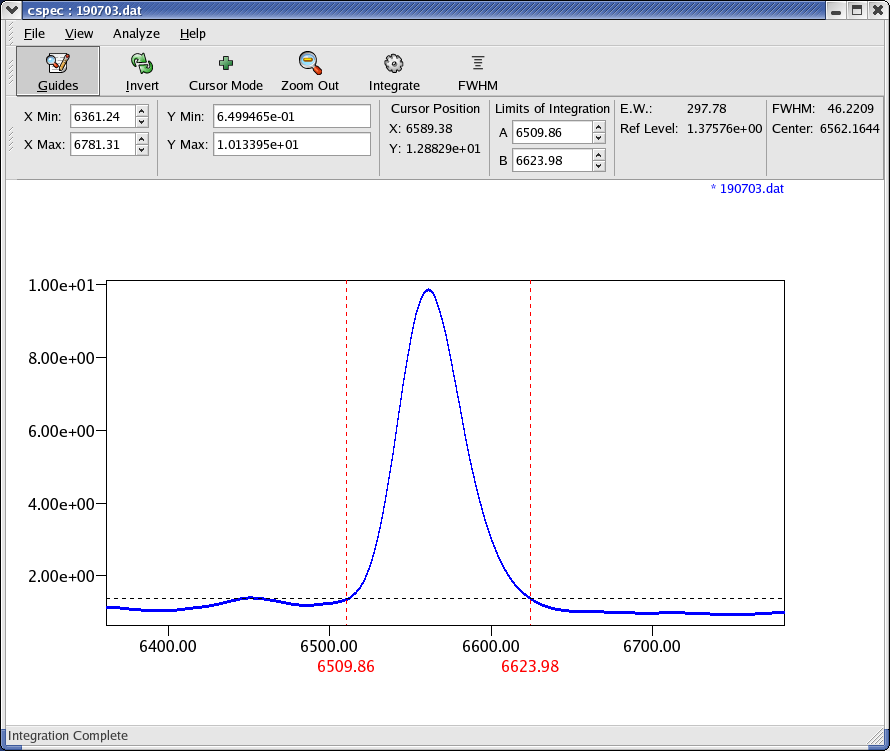
Equivalent Width
To measure equivalent width you need to set the min and max wavelength and the level of the continuum (or reference level). This is done as follows:
- Make sure the spectrum you want to analyze is the currently active spectrum by pressing the Tab key until the file name is preceded by an asterisk.
- Position the cursor at the minimum wavelength and press the A key
- Position the cursor at the maximum wavelength and press the B key
- Position the cursor at the level of the continuum and press the right mouse button
- Click the Integrate button in the toolbar. The results are displayed on the screen near the toolbar as well as written to the log file.
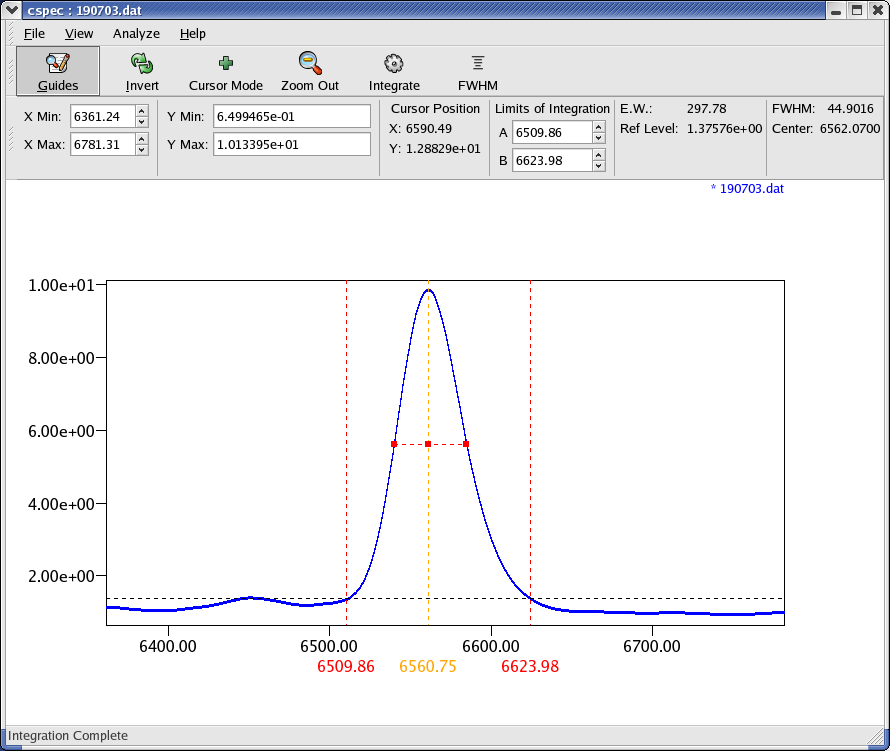
FWHM
To measure the full-width at half-maximum (FWHM) do the following:
- Make sure the spectrum you want to analyze is the currently active spectrum by pressing the Tab key until the file name is preceded by an asterisk.
- Position the cursor at the level of the continuum and press the right mouse button. This is the minimum level which the maximum will be calculated against.
- Position the cursor near the middle of the feature to be measured and press the M key. This will place the mark at that position.
- Click the FWHM button in the toolbar. The results are displayed on the screen and written to the log file.
Command Overview
| Open | Open a file in text of unifspec format. You may open up to 6 files at once. |
| Close | Close any of the open files. |
| Export | Export the plot as a JPEG, PNG or EPS (bitmap) format. |
| Print | Print the plot to the default printer using lp |
| Quit | Quit the program. |
| Guides | Toggle display of the integration limits, mark and reference lines. |
| Invert | Toggle inversion of the display colors. |
| Cursor Mode | Toggle the cursor between crosshair and lines. |
| Left-Click and Drag | Zoom In |
| Right Click | Move the reference line to the position clicked. |
| Zoom Out | Zoom all the way back out. |
| FWHM | Calculate the full-width half-max of the currently marked feature. |
| Integrate | Calculate the equivalent width. |
| Scale To... | Scale the active spectrum to another spectrum. |
| a | Set the A integration limit to the current cursor position. NOTE: You cannot set the A limit greater than the B limit. |
| b | Set the B integration limit to the current cursor position. NOTE: You cannot set the B limit less than the A limit. |
| c | Mark the centroid of the current feature. The cursor position is used as the initial guess of the centroid. |
| m | Mark the current position of the cursor. |
| Space | Reset the reference line to horizontal and in the center of the screen |
| Tab | Cycle the active spectrum to the next open spectrum. |
| Home | Move the reference line up. |
| End | Move the reference line down. |
| Insert/Page Down | Rotate the reference line clockwise. |
| Delete/Page Up | Rotate the reference line counter-clockwise. |
Email
the author with questions or problems.