|
| Documentation |
Data Archive Docs
Release Notes
Please see Techmemo #11 for the Version 1.2 Release Notes containing the details concerning the latest release of the spectra database.
The database is separated into two parts:- Spectroscopic Data (HST/STIS, and ground-based VLT/UVES)
- Image Data (HST/ACS)
General Information
Date
Date of observation can be expressed as MJD = Julian Day - 2440000.5, calendar date (yyyy/mm/dd), year (yyyy.xx), or phase in the 5.54 year spectroscopic cycle. The timeline at the top can be used to select an approximate date when observations were obtained on the query form.
The timeline on spectra query page by accessed clicking the "Show the timeline" button. Queries made using the timeline return observations within +/- 2 days of the entered dates (MJD and Calendar Date). When manually filling out the query form, enter the range of dates desired; for only one date, enter it twice.
The uncertainty in the period is +/- 10 days. Some researchers use phase in the 5.5 year cycle which, however, has no well defined zero point. An approximate phase can calculated by (T - 1998.0)/(2023 days).
Observation Identification Numbers
Please see the Technical Memos page. Specifically, have a look at Technical Memo 3 and Technical Memo 5.
Each data file has a name which indicates useful details of that observation. A file name such as "h_cd29_0020" has four parts:
- "h" is the archive code, merely signifying a high-level data product in the MAST archive.;
- "c" identifies the instrument (see below);
- "d29" is a simple three-character code for the observation date;
- "0020" is a running number for the observations in a given set. For clarity, two underscore characters ("_") always occur at the locations shown above.
Details:
- The instrument code is "c" for the STIS/CCD, "e" for the STIS/MAMA/ECHELLE data, or "u" for the UVES data.
- The 3-character date code indicates the observation year (1998=8, 1999=9, 2000=a, 2001=b, 2002=c, 2003=d, 2004=e) and fractional year, calculated from the Modified Julian Date (MJD):
f(MJD) = 2000.0 + (MJD - 51544.5) / 365.25.Thus "a20" corresponds to 2000.20 on MJD 51616.5 or 2000 March 13th.
- The observation number (four characters) identifies the sequential order for each observation date. The first observation for a given date and instrument is normally labeled "0010," some numbers are skipped, and the sequential order is determined by the FITS header keyword TEXPSTRT.
- In some cases a suffix "p" is appended to the observation number to indicate that some original data pixels were saturated and have been patched (see note 2e below). In each of these cases the unpatched data file, without a "p" suffix, is also available.
Examples:
h_cd29_0020 = STIS/CCD data, visit on 2003.29, second exposure in the set
h_ce18_0250p = STIS/CCD data, visit on 2004.18, twenty fifth exposure in the set, overexposed pixels have been patched.
Users can change the file name to anything they want after the download.
Spectroscopic Data
Instrument
There are three possible spectroscopic instrument configurations:
IMPORTANT: Note that the Gemini/GMOS and VLT/UVES data are ground-based spectra which are fundamentally different from HST/STIS spectra in several ways (see below)
- STIS/CCD - used for most of the HST observations with wavelength coverage from approximately 170 -- 1000 nm. These queries will yield the 2D spectral images obtained with various grating tilts.
- STIS/MAMA - FUV and NUV data with the Echelle (see below) covering the wavelength range from 115 -- 294 nm.
- VLT/UVES - These data are long slit ground-based spectroscopy across the SE lobe of the Homunculus (FOS4) to view the reflected spectrum of the central star from different angles and observations of the central star itself (A).
- Gemini/GMOS - These data are long slit ground-based spectroscopy across the SE lobe of the Homunculus to view the reflected spectrum of the central star from different angles and observations of the central star itself (A).
Ground-based versus HST/STIS Data
There are several notable differences between data gathered with ground-based telescopes (Gemini/GMOS and VLT/UVES) and the HST/STIS (CCD and MAMA):
- Spatial Resolution - The ground-based telescopes that have significantly worse spatial resolution than the HST. At VLT and Gemini seeing limited resolution varies between 0.5 and 2.0 arcseconds (compared with 0.05 arcseconds for the HST) and was recorded for each observation in the FITS header.
- Spectral Resolution - The VLT/UVES (R = 80,000 - 110,000) has a much higher spectral resolution than the STIS/CCD (R ~ 10,000) and comparable spectral resolution to the the STIS/MAMA Echelle (R ~ 100,000). The Gemini/GMOS (R =3700 - 4400) has a spectral resolution that is about half the spectral resolution of the STIS/CCD.
- Air vs Vacuum - The wavelength scales of the VLT/UVES and Gemini/GMOS are calculated at the index refraction of air at sea level while the HST/STIS is calibrated in vacuum.
- Atmospheric Absorption - Spectra from the Gemini/GMOS and VLT/UVES are subject to atmospheric absorption. This effect is more pronounced at longer visual wavelengths where there are several prominent terrestrial molecular bands.
Echelle Data
The most notable difference between the STIS/MAMA and STIS/CCD data (other than wavelength coverage) is that the STIS/MAMA data is in an Echelle format. "Echelle" means that several spectral orders covering different wavlength ranges are exposed simultaneously on the device. There is some wavelength overlap between orders. In the FITS files, the orders are stacked vertically (row-wise) with the shortest wavelength being in the upper left corner (largest row, first column).
In the Echelle format, the wavelength information is not stored in the WCS information for the flux array; it is provided in a separate FITS array, the "WAVE" HDU. The keyword ORDERSEP contains the number of rows in each order. So that the reference row for each order (the row passing through the slit center) can be computed as:
(Order Ref Row) = ((Order Number) + 1/2) x ORDERSEPTarget Name
- A - Central star.
- BCD - Slit positions focusing on the resolved nebula within 0.5 arcseconds of the star, including the Weigelt knots within 0.2 to 0.3 arcsec of the star. The labels B, C, and D are used mainly for historical reasons.
- HOM - Slit positions in the extended Homunculus nebula more than 0.5 arcseconds from the star.
Wavelength Range
Give the range in Angstroms, from lower to higher values or blank for no wavelength restriction.
Position Angle
Position Angle is the angle of the slit rotation. When the slit is at angle zero the slit is aligned north-south with the top of the detector (high row numbers) toward the north. Positive angles are measured from north through east. Values ranging from -180 to +360 are allowed in the search query.
Positional Searches
Improvements are currently being made to this feature.
Back to spectra query page
Image Data
Instruments
There are two possible imaging instrument configurations:
- WFPC2/PC - Some observations of the whole Homunculus nebula with the planetary camera (PC). (Not yet added to the archive.)
- ACS/HRC - The combined drizzled images in four suitable filters for each epoch (see next section)
Post-processing of the ACS/HRC data
The ACS/HRC data in this archive are combined images produced with STScI's "MultiDrizzle" routine. The normal Treasury Project observing campaign took sets of exposures with short, medium, and long exposure times in each filter during each visit. The exposures are averaged together weighted by the pixel values in the WHT array (see the ACS Data Handbook for an explaination of the WHT array). If a pixel or one of its immediate neighbors is flagged as overexposed or catastrophically bad in an exposure, then it is not used to compute the average pixel value in the combined image. The rootnames of the HST datasets included in each combined image are listed in HISTORY comments in the first and second HDUs of the FITS files.
This archive also contains data from observations by Dorland et al. (HST GO proposal #9721) that used some narrow band filters in addition to the ones usually used by the Treasury Project. We will continue to add data to the archive from our HST Cycle 15 and 16 obsservations as they become available.
Post-processing of the WFPC2/PC data
Some of the WFPC2/PC data in this archive are drizzled data that combine four point dithered observations with exposures of different lengths. This data was dark corrected and flat fielded by the STScI OTFR pipeline and then processed in a manner similar to the first example given in Chapter 6 of the HST Dither Handbook (Koekemoer, et al. 2002). The data in the archive includes drizzled flux data and the weighting mask in a single FITS file a la the format of the ACS/HRC data. The root names of the observatoins that are included in each dithered data product are listed in the primary fits header along with the drizzle parameters.
Field of View & Pixel Size
ACS/HRC
- Field of View: 29" x 29"
- CCD Pixel Size: 0.028" x 0.025"
- Processed Pixel Size: 0.025" x 0.025"
ACS Dithering
The drizzled ACS/HRC images used to make the combined images in the database were products of a standard 2 or 4 point dither. All the short exposures used 4 point box dithers.
WFPC2/PC
- Field of View: 36.8" x 36.5"
- CCD Pixel Size: 0.046" x 0.046"
- Processed Pixel Size: 0.023" x 0.023"
WPFC2 Dithering
Some of the WFPC2/PC images were observed using a standard 4 point dither. Those images were drizzled combining both long and short exposures into single images in the archive.
Roll Angle & WCS Information
All the images in the archive are oriented at the HST roll-angle for the visit. A WCS header is included which gives the roll-angle and the transformation from pixel row and column to RA and Declination. The WCS information is good for measuring relative positions in the field. However, the absolute RA and Declination in the WC may be wrong by 0.1 arcseconds or worse!
Exposure Lengths
The exposures times given for each image in the database are the longest exposure which was used to make that combined image. See the section above for details on how the combined images were made. The exposure times for the individual exposures that were combined to create the image are given in the primary FITS HDU under the keywords EXPTIME1, EXPTIME2, etc.
Filters
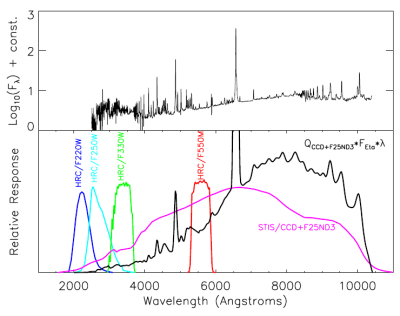
The normal ACS/HRC observing program used four filters: F220W, F250W, F330W, and F550M. The band-passes of those filters are shown in Fig 1 below superimposed a spectrum of Eta Car from 1999. The F220W and F250W filters sample the NUV part of the spectrum, which is dominated by ionized metal line blanketing. F330W is dominated by emission from the Balmer discontinuity. F550M samples mainly continuum with few strong emission features. The F250W and F330W images are normally expected to have the HST's best spatial resolution.
The WFPC2 observations were made with the F336W, F255W, and F631N filters. The F631N filter measures continuum brightness uncontaminated by emission features. The F336W and F225W filters are comparable to the F330W and F250W filters for the ACS/HRC. The photometric keywords in the FITS headers are calibrated by STScI to allow direct comparison between photometry from the ACS/HRC and WFPC2.
Fig. 1 ACS/HRC filters and the STIS/CCD sensitivity plotted with a typical spectrum of Eta Carinae from 1999.
Important Caveats
- The ACS/HRC and some of the WFPC2 data are composed from MultiDrizzled images so all the caveats pertaining to MultiDrizzled data apply (i.e. small aperture photometry corrections).
- In some cases a pixel may have been bad in all the combined images. In this case, the pixel value in the combined image is NaN (Not A Number). We refer to NaN as defined in IEEE 754. We use a quiet NaN (QNaN) which is explicitly generated by the expression: NaN=(-999./0.0).
- The ACS/HRC occulting bar is visible in many of the images as a "finger" which may block out part of the Homunculus nebula.