|
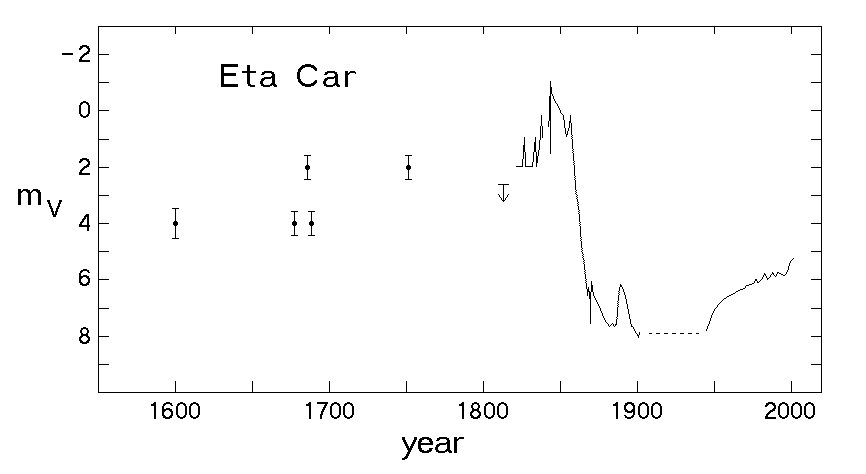
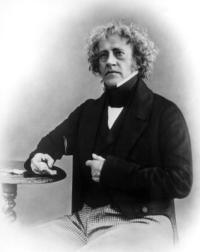
Beginning about 180 years ago eta Carinae entered a period of remarkable variability culminating in its famous "great eruption" from 1837 to 1858 when it became one of the brightest stars in the sky. Earlier observations show that it had oscillated between fourth and second apparent magnitude for centuries in possible S Dor--type outbursts ( Humphreys and Davidson 1994, Humphreys, Davidson and Smith 1999). Fortunately John Herschel and several others recorded eta Car's behavior during its eruption when for 20 years it oscillated between apparent magnitudes 0 and 1.5, briefly reaching -1. It then rapidly declined in about 10 years to below naked--eye visibility, eventually to about 7--8th in apparent mag. due both to the cessation of the eruption and the formation of dust. Figures 1 and 2 show its historical light curve up to the present and the details of its variability during the 19th century. A recent discussion of its light curve with the historical references can be found in Humphreys, Davidson and Smith 1999. |
| |
|
|
Figure 1The historical light curve of eta Car from 1600 to the present. Note the two--magnitude oscillations prior to the "great eruption". Magnitudes after the great eruption refer to the integrated light of the Homunculus nebula. | |
Figure 2The light curve during the 19th century showing the details of the "great eruption" and the second eruption with a correction for the probable circumstellar extinction at that time. |
| |
Eta Car's second or lesser eruption began in 1887 and lasted seven years. The first photographic spectrum, obtained in 1892-1893 during this outburst, resembled an F--type supergiant with strong hydrogen emission lines. This second eruption had many characteristics in common with what we think of as an S Dor or normal LBV--type outburst (see "related Objects") including its duration, change in apparent brightness and spectral type. When corrected for a reasonable estimate of the circumstellar extinction at that time (Figure 2 above) we see that this second outburst was not so minor and that the star rose significantly above its normal quiescent level.
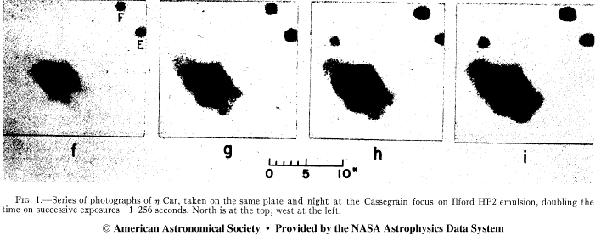
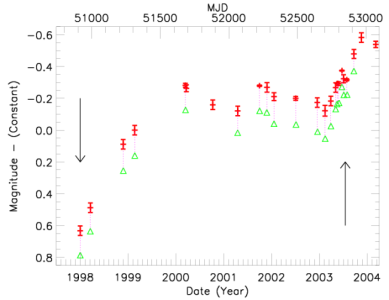
The star was then apparently quiescent near 8th magnitude until the 1940's. In 1942, it began to brighten rapidly and in less than 10 years was near naked--eye visibility again ( de Vaucouleurs and Eggen 1952). It was also during this time that images clearly revealed the nebula we now identify with the great eruption and that Gaviola (1950) nicknamed the "Homunculus" or "little man." Visual observers in the early years of the 20th century had previously noted that eta Car was non-stellar. Figure 3 (below) shows the details of the groundbased light curve from 1900 to the present. It is important to realize that the groundbased magnitudes shown since the great eruption refer to the integrated light over the nebula and not the central star. So why did it brighten so quickly? Most astronomers assume that the rapid brightening was caused by the destruction of dust. That may be correct, but why were at least two magnitudes of circumstellar extinction by dust removed so quickly? During the past 50 years the Homunculus has continued to brighten much more slowly possibly due to expansion of the nebula with small oscillations observed in both the visible and near-infrared until very recently when HST/STIS observations showed that the central star itself brightened significantly between 1997 and 2001 and is continuing to brighten after its recent (2003.5) "event" (Figure 4, below).
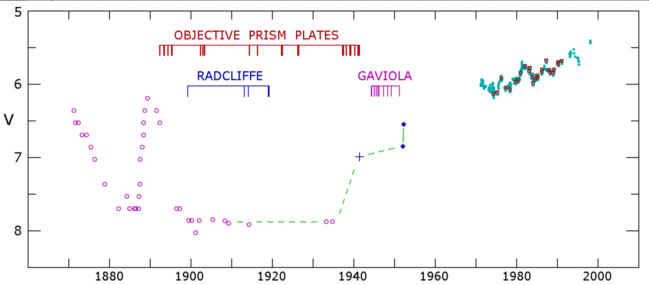
The light curve from 1900 to the present. Note the rapid increase in the integrated brightness over the ten year period from about 1943-43 to 1953.
|
Figure 4This is an up-to-date version of figure 4 from Martin and Koppelman (2004). The plus signs with error bars are the average relative brightness of the central star (resolved from the Homunculus) measured from HST/STIS CCD aquisition images. The open triangles are the measurements with the flux from the Balmer H alpha line subtracted. |
A Mysterious Spectrum EmergesWhat we now think of as the "normal" groundbased spectrum of eta Car with its very complex spectrum of high excitation emission lines was first described by Gaviola (1953) based on spectra obtained between 1944 and 1948. We now know that the high excitation lines arise in the nearby ejecta and during the "spectroscopic event" these lines weaken and the low excitation lines dominate the spectrum. Feast, Whitelock and Marang (2001) examined the historical spectra in the plate collection at the South African Astronomical Observatory. They found that beginning in 1947 the spectroscopic behavior of the star fits the spectroscopic 5.5 year pattern, the spectrum of the star was always in the "low excitation state" prior to 1920 (1899-1919). Humphreys (to be published 2004) has recently examined the objective prism spectra (1892 - 1942) in the Harvard plate collection and concludes that there were no apparent high excitation lines up to 1942. Thus there was no obvious 5.5 year spectroscopic cycle prior to 1948 when Gaviola first reported a decrease in the strength high excitation lines. |
|
So what caused the onset of the spectroscopic cycle? Or why weren't the "spectroscopic events" observed prior to 1948? This is just one example of the many astrophysical questions and puzzles that still are unanswered about eta Car.
de Vaucouleurs, G. and Eggen, O. C. 1952, Pub. A.S.P., 64, 185.
Feast, M. W., Whitelock, P. and Marang, F. 2001, MNRAS, 322, 741.
Gaviola, E. 1950, ApJ., 111, 408.
Gaviola, E. 1953, ApJ., 118, 234.
Humphreys, R. M. and Davidson, K. 1994, Pub. A.S.P., 106, 1025.
Humphreys, R. M., Davidson, K. and Smith, N. 1999, Pub. A.S.P., 111, 1124.