|
| History of Eta Carinae |
History of Eta Carinae
Before 1880: The Great Eruption
After 1880: A Second Eruption and More Recent Brightening
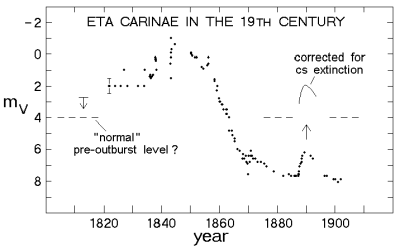
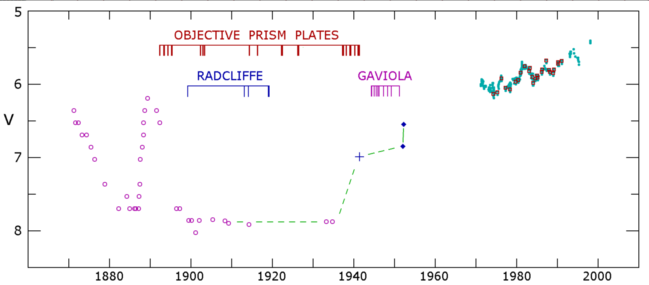
Eta Car's second or lesser eruption began in 1887 and lasted seven years. The first photographic spectrum, obtained in 1892-1893 during this outburst, resembled an F--type supergiant with strong hydrogen emission lines. This second eruption had many characteristics in common with what we think of as an S Dor or normal LBV--type outburst including its duration, change in apparent brightness and spectral type. When corrected for a reasonable estimate of the circumstellar extinction at that time (Figure 2 above) we see that this second outburst was not so minor and that the star rose significantly above its normal quiescent level.
 Early images of the Homunculous of Eta Car from []
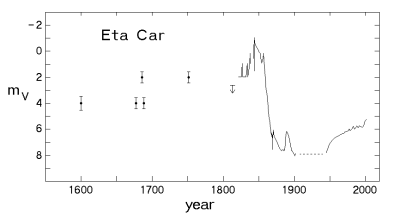
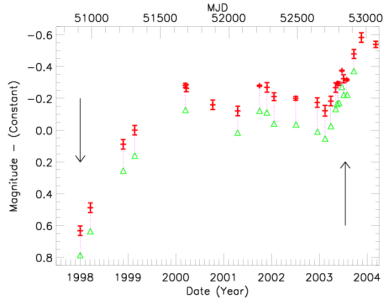
The star was then apparently quiescent near 8th magnitude until the 1940's. In 1942, it began to brighten rapidly and in less than 10 years was near naked--eye visibility again [] . It was also during this time that images clearly revealed the nebula we now identify with the great eruption that Gaviola [,] nicknamed the "Homunculus" or "little man." See image above. Visual observers in the early years of the 20th century had previously noted that eta Car was non-stellar. Figure 3 (below) shows the details of the groundbased light curve from 1900 to the present. It is important to realize that the groundbased magnitudes shown since the great eruption refer to the integrated light over the nebula and not the central star. So why did it brighten so quickly? Most astronomers assume that the rapid brightening was caused by the destruction of dust. That may be correct, but why were at least two magnitudes of circumstellar extinction by dust removed so quickly? During the past 50 years the Homunculus has continued to brighten much more slowly possibly due to expansion of the nebula with small oscillations observed in both the visible and near-infrared until very recently when HST/STIS observations showed that the central star itself brightened significantly between 1997 and 2001 and is continuing to brighten after its 2003.5 "event" (Figure 4, below).
A Mysterious Spectrum Emerges
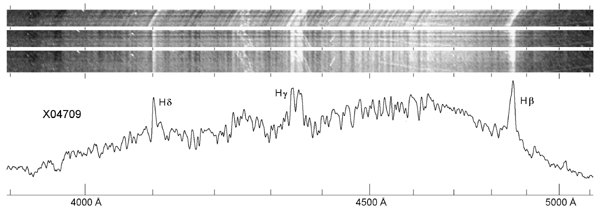
What we now think of as the "normal" groundbased spectrum of eta Car with its very complex spectrum of high excitation emission lines was first described by [] based on spectra obtained between 1944 and 1948. We now know that the high excitation lines arise in the nearby ejecta and during the events these lines weaken and the low excitation lines dominate the spectrum. Feast, Whitelock, and Marang [] examined the historical spectra in the plate collection at the South African Astronomical Observatory. They found that beginning in 1947 the spectroscopic behavior of the star fits the spectroscopic 5.5 year pattern, but the spectrum of the star was always in the "low excitation state" prior to 1920 (1899-1919). Humphreys, et al. [] examined the objective prism spectra from 1892 - 1941 in the Harvard plate collection. The relatively high-excitation He I λ4471 and [Fe III] λ4658 emission, conspicuous in spectra today, were absent or very weak throughout those years. They quantified their measurements by digitizing selected high quality plates. An example is shown here Figure 5. We also show the famous spectrum from 1893 during eta Car's second eruption and illustrating the F-type supergiant absorption lines and strong H emision formed in its dense wind, Figure 6.
The star was in its "low" spectroscopic state from 1900 to 1942. Thus there was no obvious 5.5 year spectroscopic cycle prior to 1948 when Gaviola first reported a decrease in the strength high excitation lines.