|
| Luminous Blue Variables |
Luminous Blue Variables (LBVs)
In quiescence an LBV or S Doradus variable is a moderately evolved hot star, with a B-type supergiant or Of-type/late-WN spectral classification. During the "eruption" or maximum visible light stage, increased mass loss causes the wind to become optically thick, sometimes called a pseudo-photosphere, at T~7000-9000 K with an absorption line spectrum resembling an F-type supergiant. Since this alters the bolometric correction, the visual brightness increases by 1--2 magnitudes while the total luminosity remains approximately constant [, ] and numerous early references therein) or may decrease []. Such an event can last for several years or even decades. Basic causes of the instability remain somewhat mysterious; most proposed explanations invoke an opacity-modified Eddington limit, subphotospheric gravity-mode instabilities, and super-Eddington winds (see [, , ]).
Two interesting examples SN2002kg and the historic SN1954J both in the nearby spiral galaxy NGC 2403 illustrate the differences among the LBVs and the giant eruptions []. Both received a supernova designation. SN2002kg's eruption was sub-luminous and it was quickly reognized as a non-supernova. It was identified with the "irregular blue variable" V37 in NGC2403 [], a known LBV/S Dor variable in its maximum light stage [,]. V37's pre-eruption luminosity and its luminosity near maximum was approximately MBol -10.4 mag or 106 L⊙ and possible initial mass of 60 - 80 M⊙. Like other LBVs/S Dor variables, V37s outburst was an apparent transit on the HR Diagram, at nearly constant luminosity due to increased mass loss and the formation of a cooler, dense wind. Its high mass loss stage lasted about 13 years
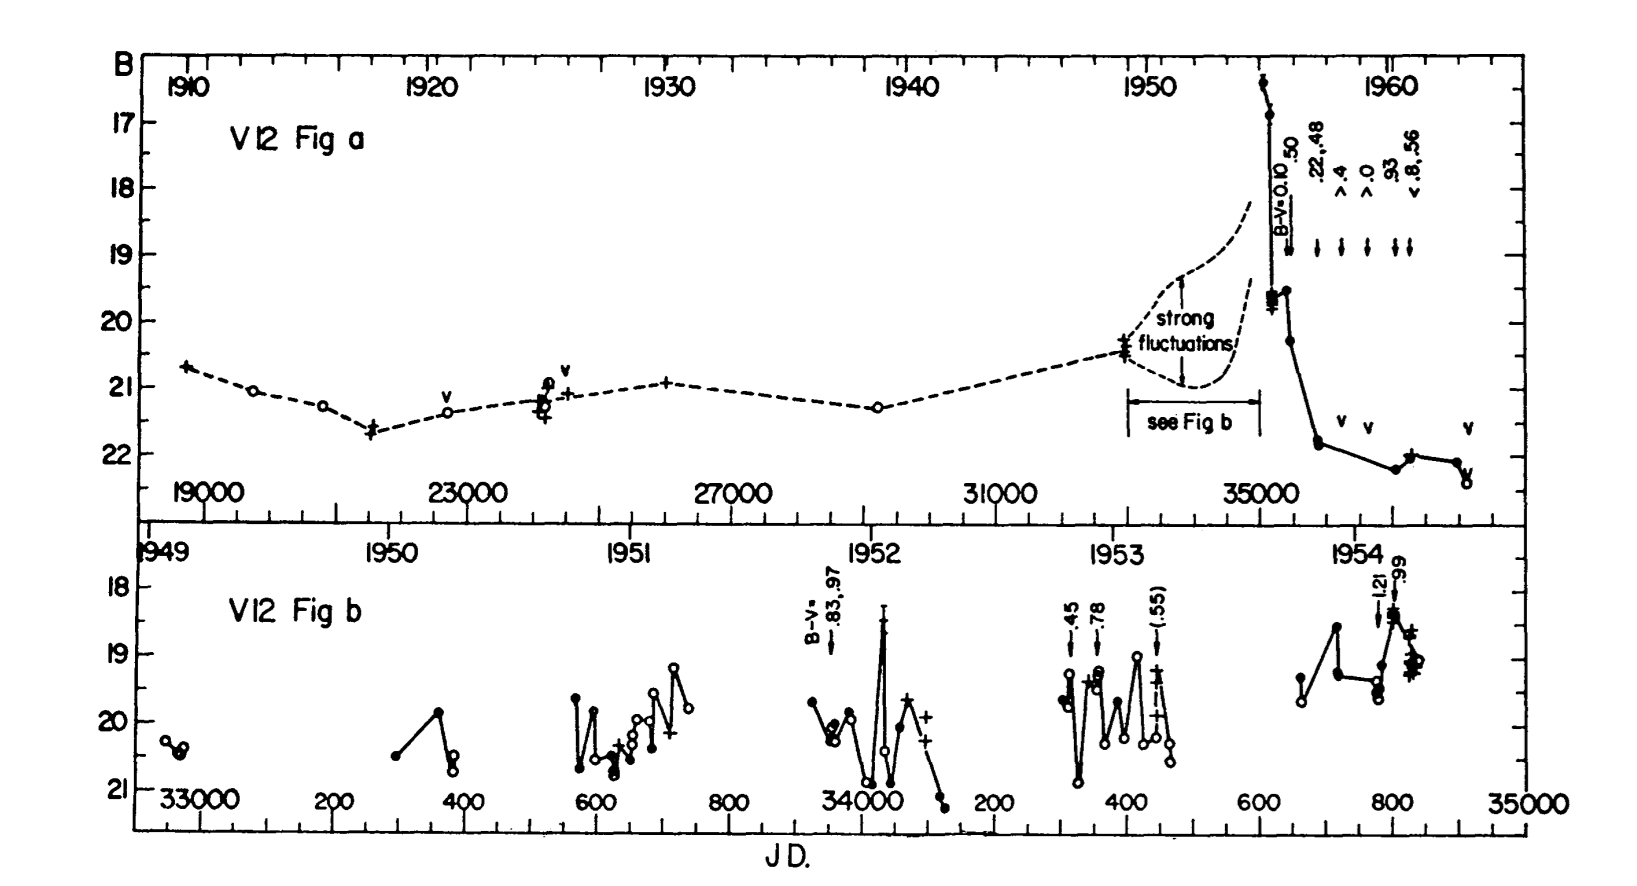
SN1954J, also known as V12 in NGC2403, is a giant eruption. Based on its peculiar light curve (Figure 1) and its resemblance to eta Car and SN1961V, it was also considered another possible example of Zwicky's Type V supernovae. Its pre-eruption light curve is remarkable for the rapid variations in its apparent magnitude in the years 1950 -1954 prior to its giant eruption, sometimes a half magnitude or more in only a few days. These erratic fluctuations are most likely due to a short term surface instability distinct from the LBV/S Dor long-term eruptions which have different characteristics. It increased by five magnitudes in apparent brightness and its absolute magnitude at maximum was at least - 13 or ≈ 107 L⊙. Its actual maximum lasted about a year. Its maximum luminosity and its pre-maximum outbursts are similar to other SN impostors or giant eruptions. HST imaging ([]) resolved V12 into four stars, one of which is very bright in Halpha, and is the likely survivor. But this likely survivor is 2.5 - 3 mag or about 10 times fainter than the progenitor star with a peculiar energy distribution. The mystery was solved when spectra obtained with the Large Binocular Telescope showed that the survivor is actually two stars, a hot supergiant with a cooler companion G supergiant, and the fading could be explained by large grains of circumstellar dust formed during the eruption [].
One of the most distinguishing characteristics of LBV/S Dor variability is that during quiescence or minimum light, the stars lie on the S Dor instability strip first introduced by Wolf [] and illustrated here in Figures 2 and 3 for confirmed LBVs in the nearby spirals M31 and M33 and in the Large and Small Magellanic Clouds [].
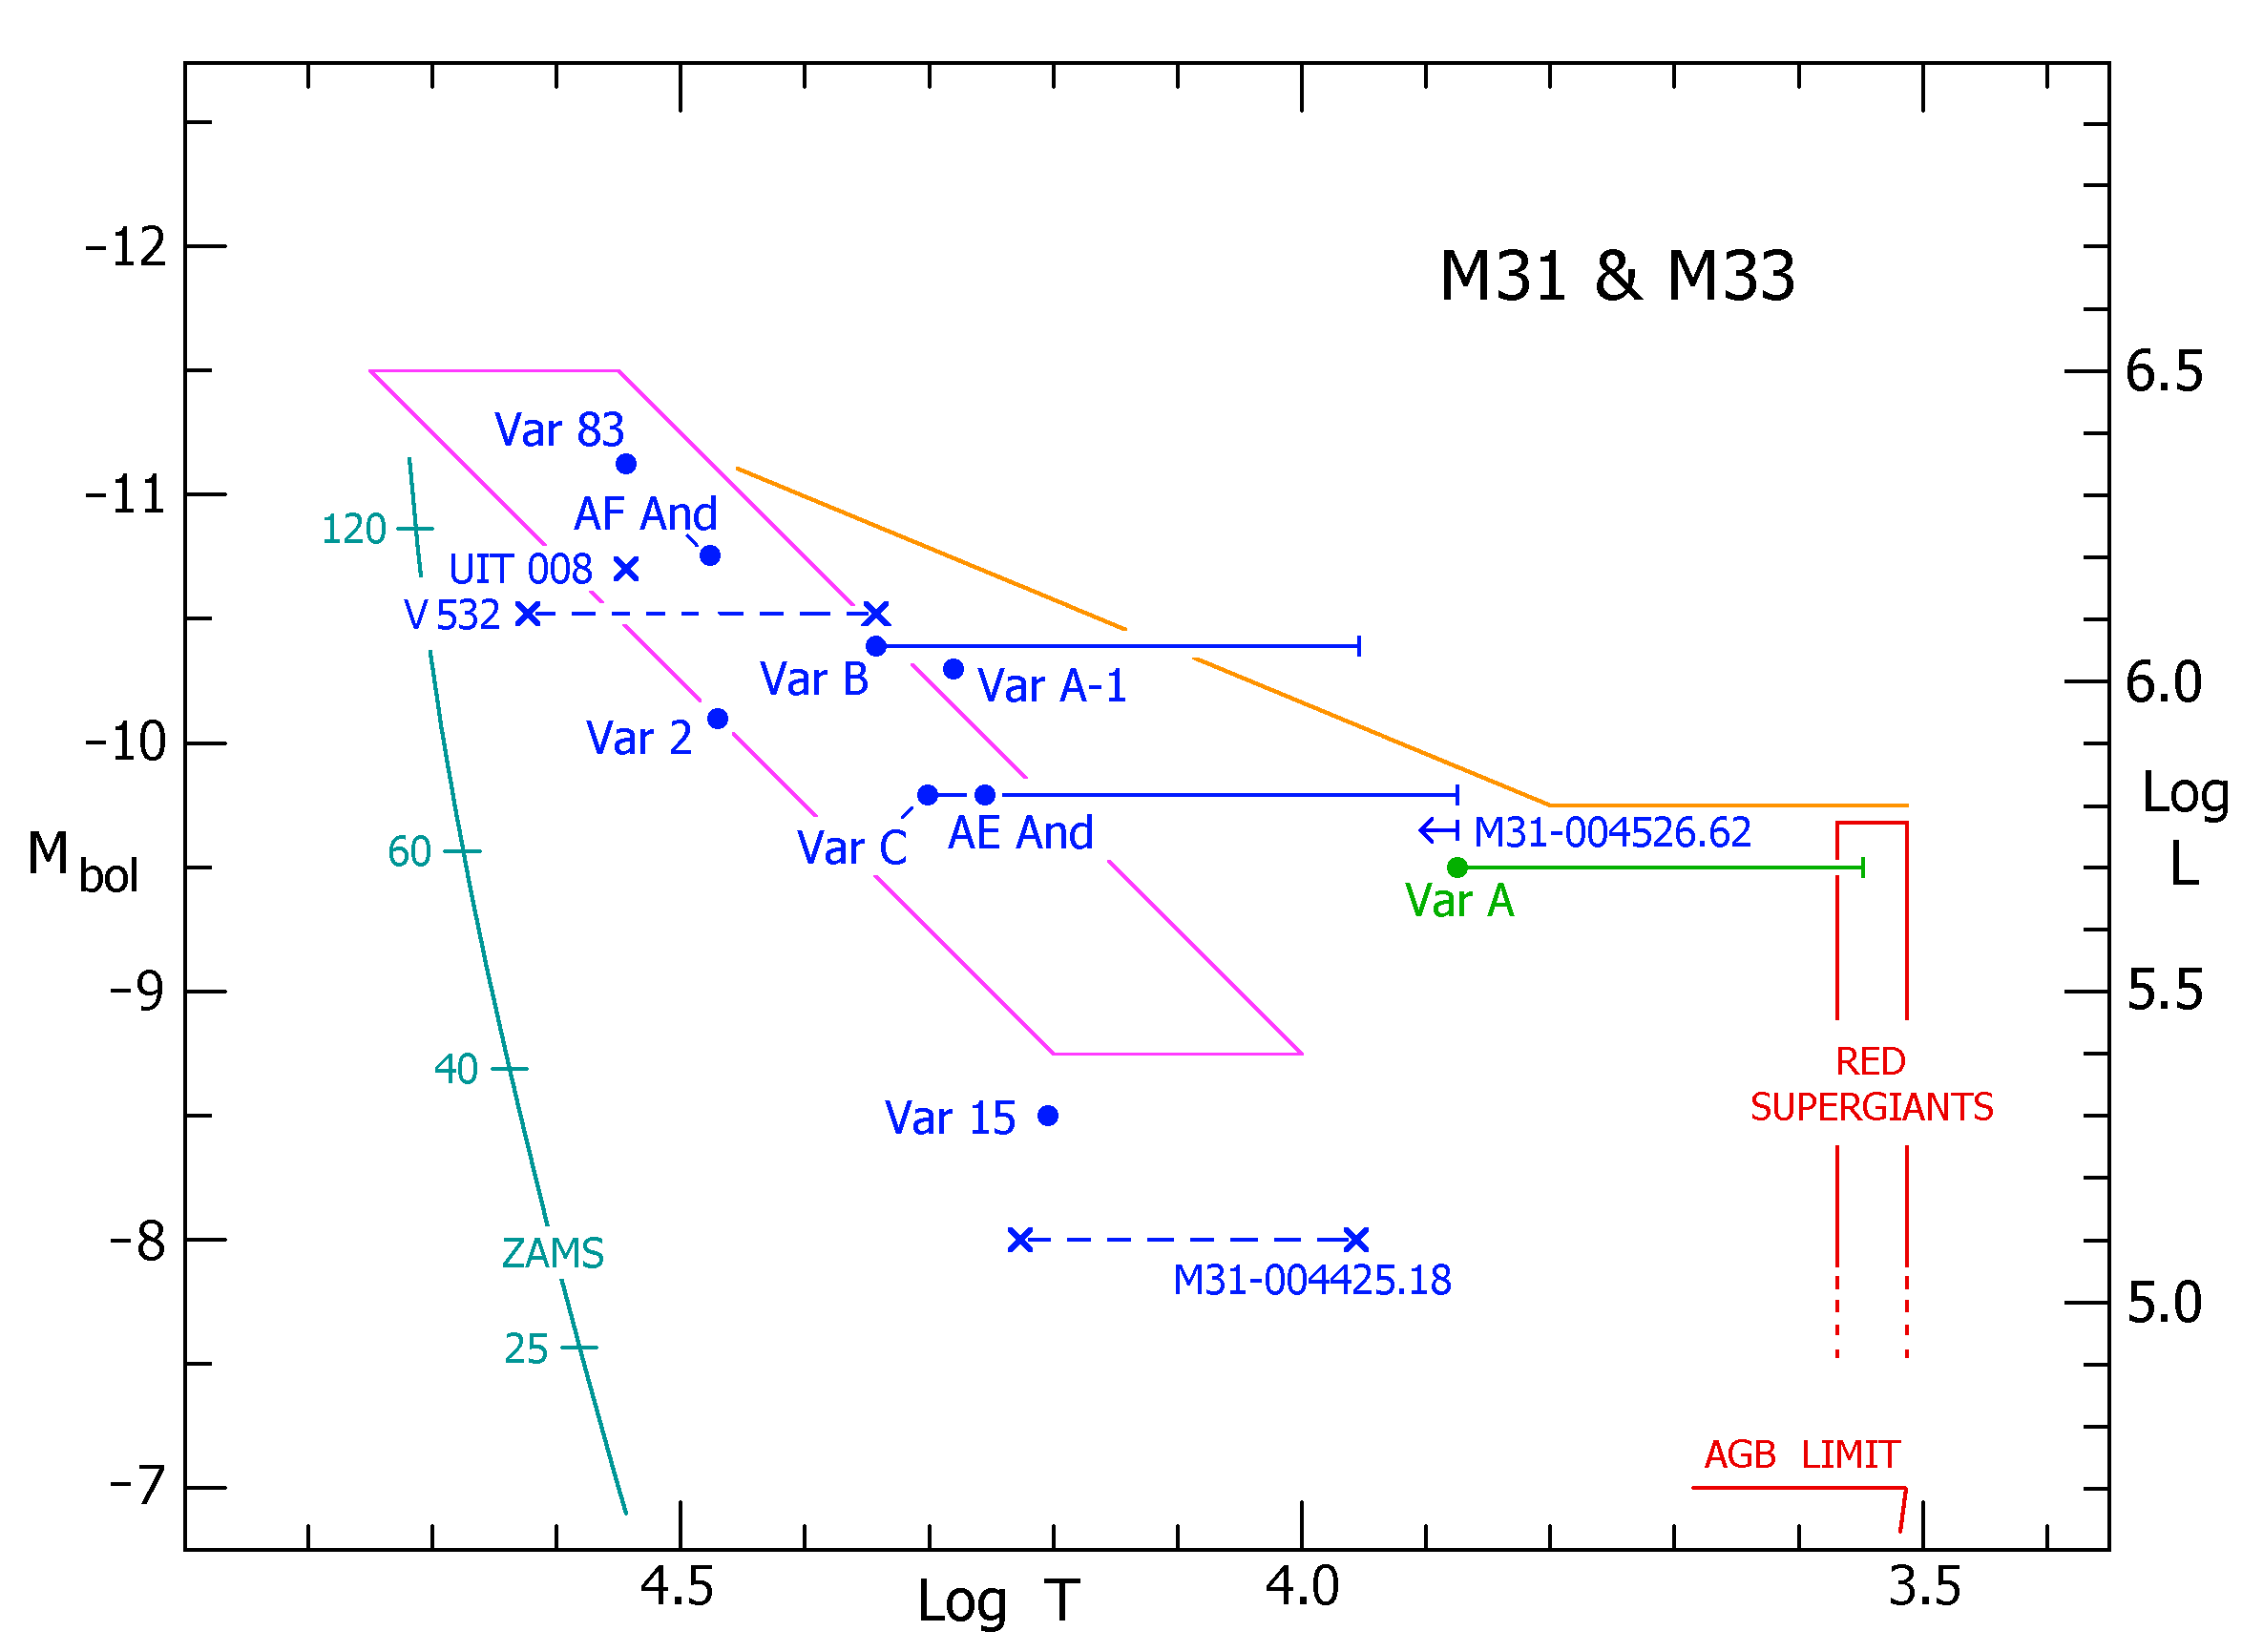
A schematic HR Diagram for the LBVs and candidate LBVs in M31 and M33. The apparent transits in the HR Diagram during the LBVmaximum light or cool, dense wind stage are shown as straight blue lines. The LBV/S Dor instability strip is outlined in pink and the empirical upper luminosity boundary is shown in orange.
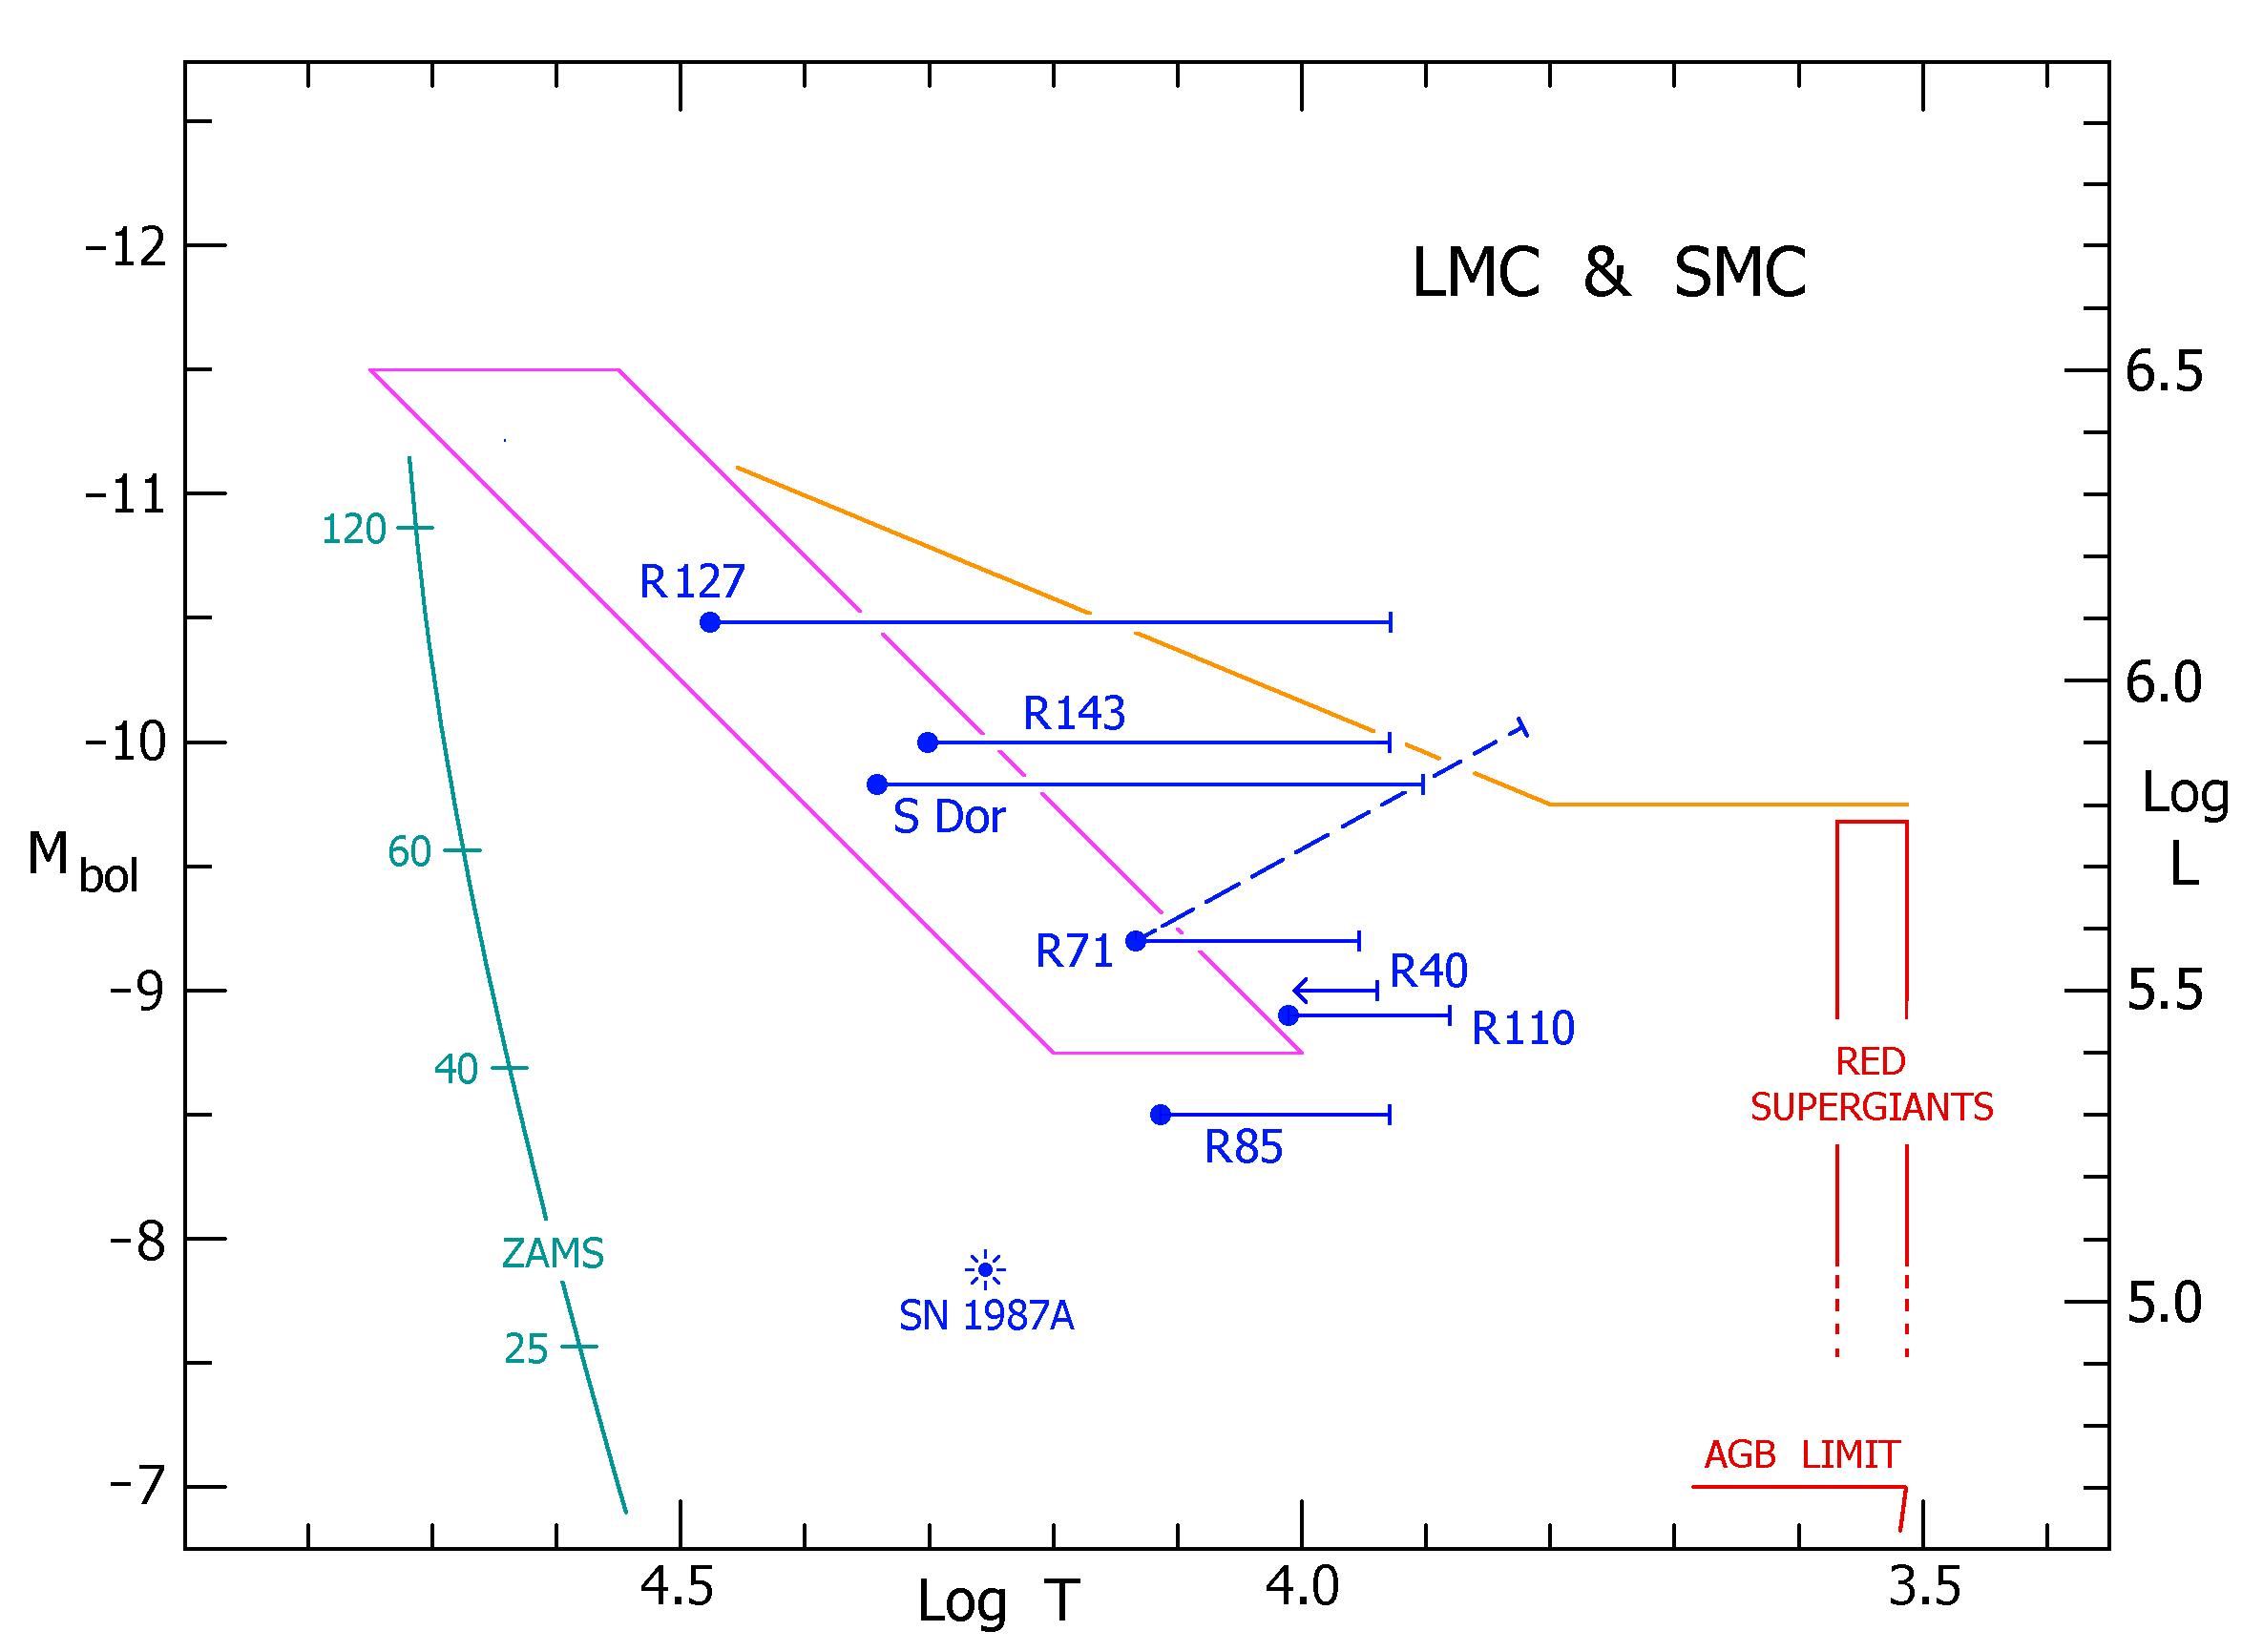
A schematic HR Diagram for the LBVs and candidate LBVs in the LMC and SMC. The symbols and colors are the same as in Figure 2.
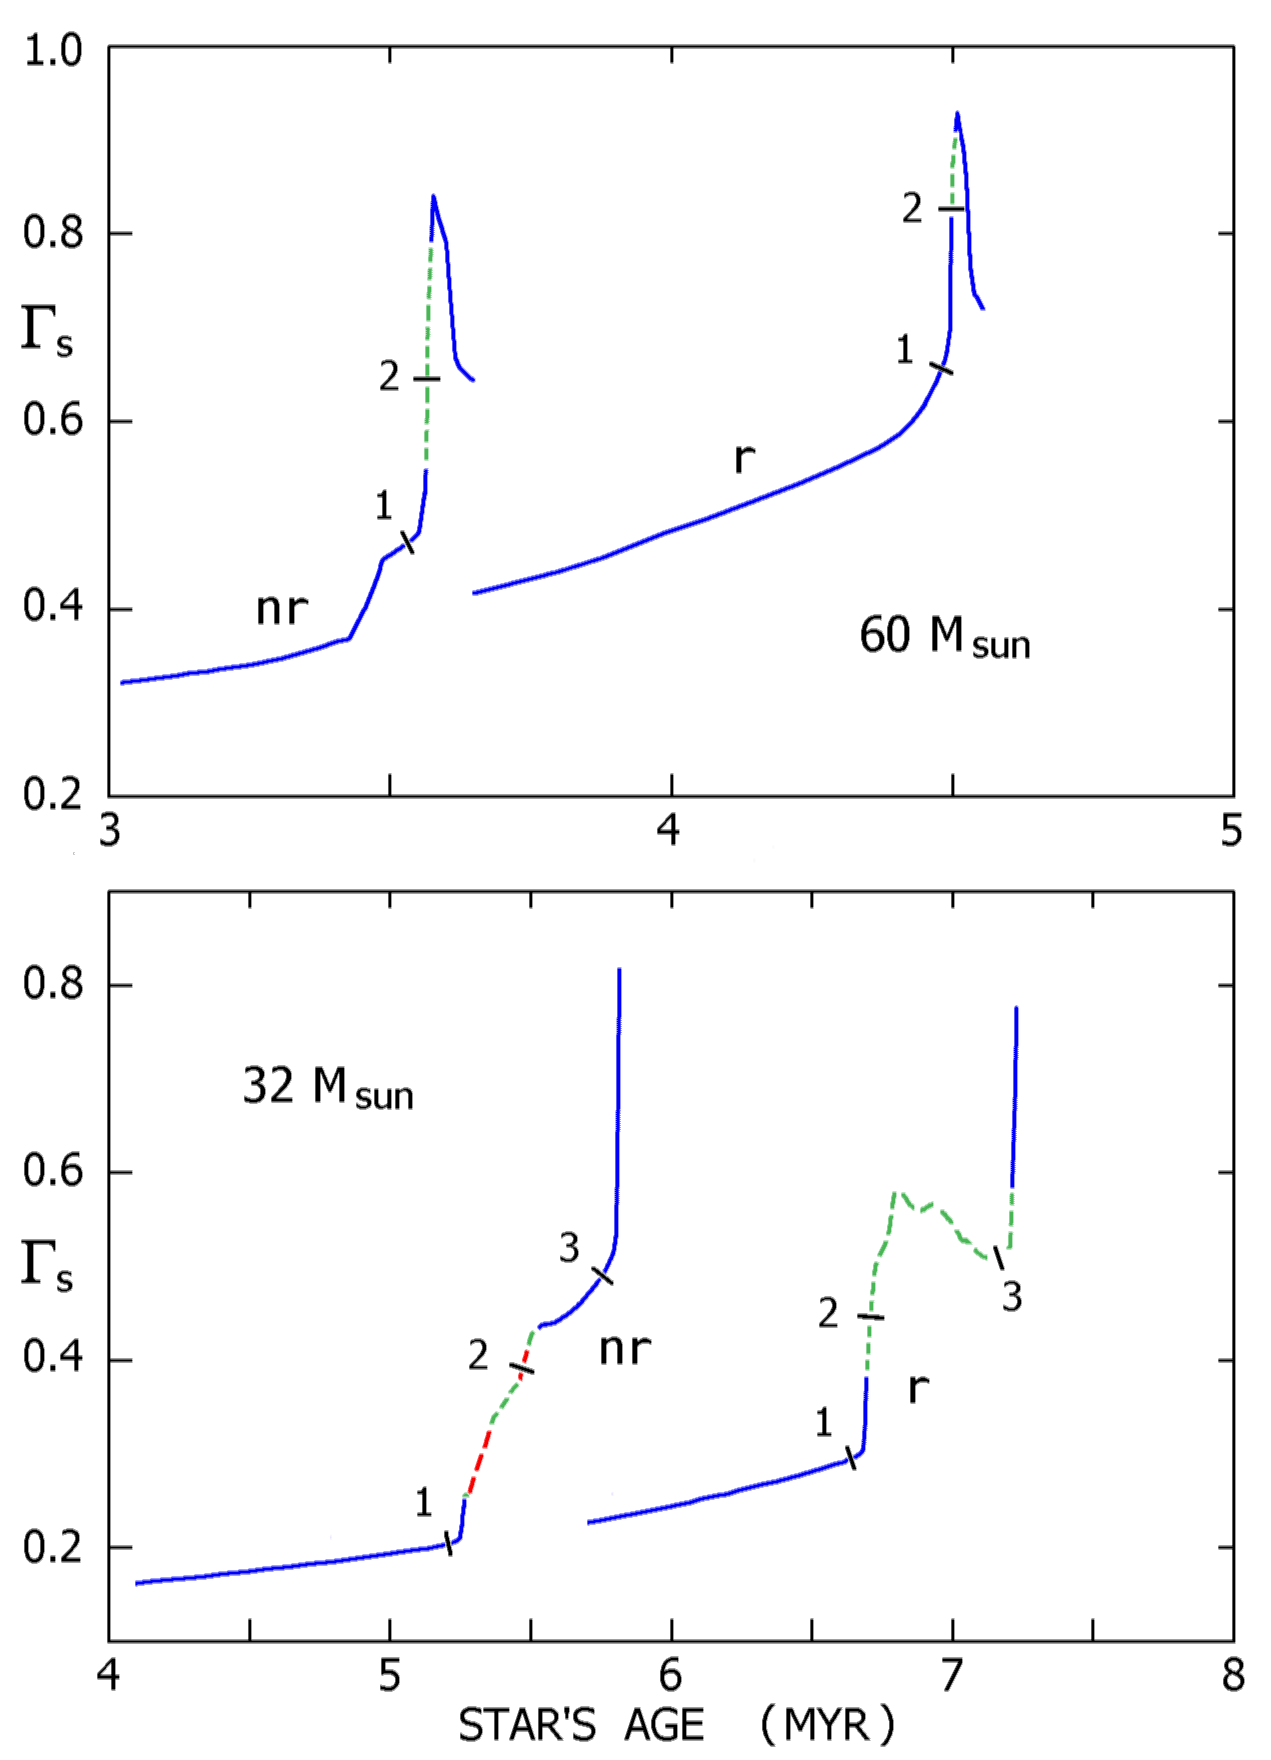
The Eddington parameter for two initial masses as a function of time. See text.
Normal mass losing supergiants are found in the S Dor instability strip. Thus some factor must distinguish LBVs from the far more numerous ordinary stars with similar Teff and L, and L/M is the most evident parameter. LBVs have larger L/M ratios than other stars in the same part of the HR Diagram. Their Eddington factors Γ = L/LEdd are around 0.5 or possibly higher. This is not surprising for the very massive classical LBVs. But how can the less luminous LBVs have such large L/M ratios? The simplest explanation is that they have passed through a red supergiant stage and moved back to the left in the HR diagram []. show that stars in the 22 -- 45 M⊙ initial mass range, evolving back to warmer temperatures, will pass through the LBV stage, and recent evolutionary tracks, with mass loss and rotation [], show that these stars will have shed about half of their initial mass. Having lost much of their mass, they are now fairly close to (L/M)Edd. Although empirical mass estimates are uncertain, the low luminosity LBVs are close to their Eddington limit with Γ ≈ 0.6 []. Hence the evolutionary state of less-luminous LBVs is fundamentally different from the classical LBVs.
To illustrate this, in Figure 4 we show the evolution of L/M for two differen t masses representing the two LBV/S Dor classes. It shows a simplified Eddington factor, Γs=(L/L⊙)/(43000 M/M⊙), as a function of time in four evolution models reported by [] for rotating and non-rotating stars with MZAMS= 32 and 60 M⊙. The 32 and 60 M⊙ models have log L ~ 5.6 and 6.0, respectively, when they are in the LBV instability strip (see Figs.\ 2 and 3). Three critical evolution points are marked in the figure: (1) The end of central H burning, (2) the farthest major excursion to the red side of the HR Diagram, and (3) the end of central He burning. For the 60 M⊙ star, Γs ≳ 0.5 as it leaves the main sequence, but the 32 M⊙ star must pass through yellow and/or red supergiant stages before its Γs reaches 0.5.