|
| Supernova Impostors |
Giant Eruptions and Supernova Impostors
In 1965 Fritz Zwicky proposed his "Type V" class of supernovae, with relatively faint maximum luminosities but long durations. He cited only two members, SN 1961V and eta Carinae, but more examples have since been recognized in the modern supernova surveys. Today we know that most of them were giant eruptions whose stars survived, not true supernovae. These are the most energetic non-terminal stellar explosions known, sometimes ejecting several M⊙ of material. Such high mass loss episodes probably dominate the mass-loss budget for stars above 50 -60 M⊙, critically altering their evolution [, , ]. But the theory for the giant eruptions is still largely conjectural, most likely involving poorly understood instabilities near the Eddington limit, super -Eddington luminosities, and massive radiation-driven outflows ; see, e.g., "Eta Carinae and the Supernova Impostors", [], [].
The numerous transient surveys are finding an increasing number of what appear to be non-terminal giant eruptions, apparently from evolved very massive stars. Many of these giant eruptions are spectroscopically similar to the Type IIn supernovae and thus receive a SN designation, but are later recognized as sub-luminous or their spectra and light curves do not develop like true supernovae. Hence the "supernova impostors" nametag (see [] for a review). At maximum light they typically reach absolute visual luminosities on the order of -13 to -16 mag while true supernovae explosions are brighter than -17 mag. This is a diverse group of objects with a range of luminosities and possible progenitors. A few impostors appear to be normal LBV/S Dor variables in the eruptive or maximum light state, while most are giant eruptions possibly similar to eta Car. Those that are heavily obscured may be in a post-AGB or post red supergiant stage, i.e. the Intermediate Luminosity Red Transients (ILRTs) []. Of course the true test of an impostor is that it survives the giant eruption.
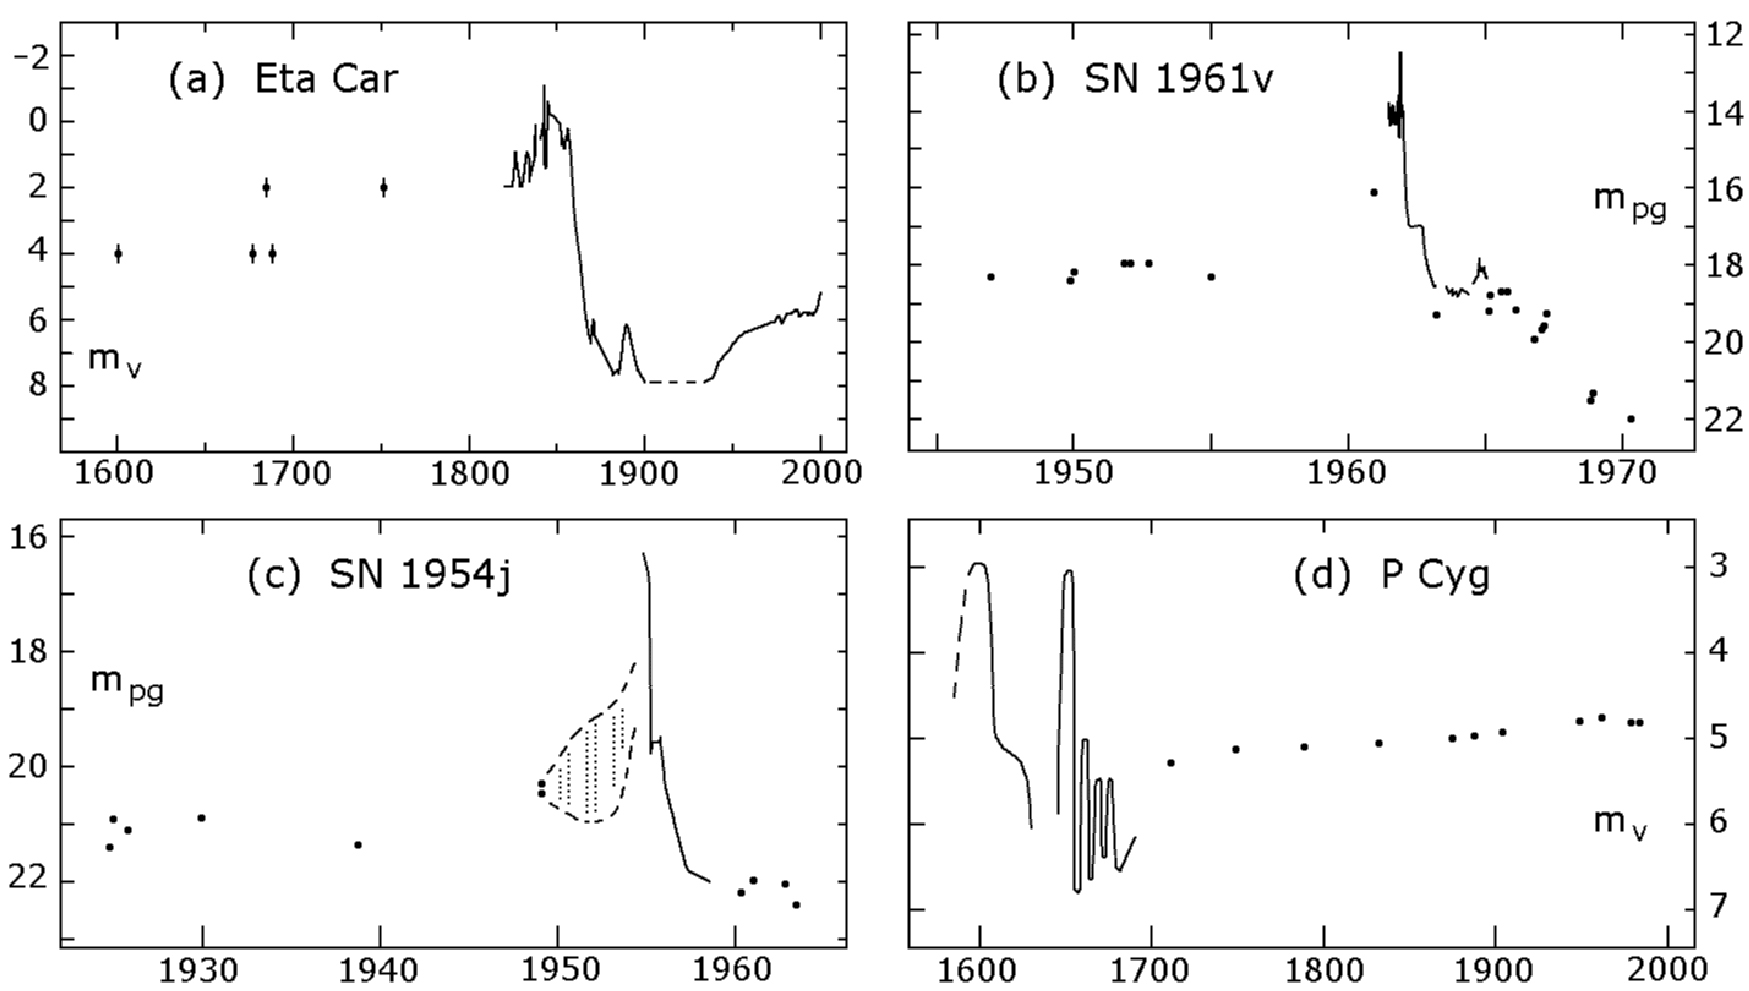
Historic light curves for four Eta Car variables or SN Imposters
Three of the four famous historical examples eta Car, P Cyg, and SN1954J [, ], survived their giant eruptions while the fourth, SN1961V, is still controversial ([],[]). Their historical light curves are shown here.
The distinction between giant eruptions and the more common LBV or S Dor-type variability is often overlooked in the literature. In a giant eruption the total luminosity substantially increases. The energetics of the giant eruptions, the duration, and what we observe are quite different from LBV/S Dor variability. The origin of the instability, their progenitors, and evolutionary state of the giant eruptions and the classical LBVs may also be different.
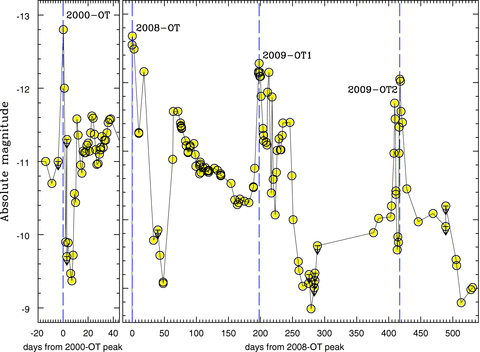
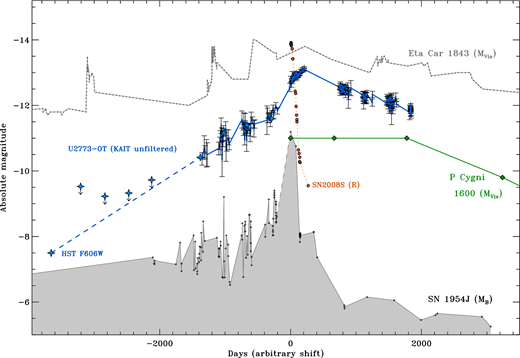
There are now several known SN impostors in the literature. Some have been identified with progenitors and survivors. Repetitive eruptions have been observed in more than one and in one case the eruptions may have been followed by a terminal explosion (SN2009ip). Representive examples are shown in Figure 2. There appear to be two situations:
- The star experiences a giant eruption and survives. In this case the instability maybe photospheric or possibly driven by an interior instability.
- The giant eruptions appear to precede the terminal explosion. Is the instability in the interior or core?

Giant Eruptions and Super-Eddington Winds
A giant eruption” is a super-Eddington mass outflow, driven by continuum radiation pressure. It is not driven by a shock wave, though shocks may propagate through the flow. It’s opaque, so the photosphere is located at a fairly large radius in the outflow. The eruption usually persists for months or years, much longer than any relevant dynamical timescale and it may be non-spherical, e.g. eta Car. Ordinary LBV outbursts are not giant eruptions, but they have physical similarities.
We often mention the Eddington factor Γ = L/LEdd, where LEdd ≈ 4 πcGM/κ . Most of the opacity κ is due to Thomson scattering, but the relatively small absorption opacity determines the size of the photosphere, Eta Car’s great eruption had Γ ∼ 2 to 10, while normal LBVs have Γ approximately 0.5. SN 2009ip had Γ > 50.
In principle a giant eruption can originate in more than one way. The instability might be due to the “opacity-modified Eddington limit” not far below the star’s photosphere, or (more likely) it may involve strange-mode instabilities in the notorious high-opacity layers where T ∼ 3 × 10⁵ K . Either way, a lot of extra radiation pushes material while diffusing outward.
Giant eruptions, LBV eruptions, and other mass outflows typically have apparent temperatures between 7000 and 9000 K at maximum brightness. This fact is a consequence of opacity physics, and does not imply that the outbursts had similar causes. The average temperature of escaping radiation represents the “thermalization depth” where √ (3 τtot τabs) ∼ 1. A crucial fact is that opacity decreases rapidly below T ∼ 7500 K, and very rapidly below 6500 K. Thus we find some interesting generalities for a wind or outflow with a given luminosity A moderate mass-loss rate can produce apparent temperatures around 8000 K, defined in a particular way. But reducing that to 7000 K requires a substantially larger density or mass-flow rate; 6000 K implies a rather huge rate; and much lower temperatures are unlikely in practical terms. Since temperatures in this range also have bolometric corrections near zero, it is entirely natural that opaque outflows of all kinds often look like T ∼ 7500 K at maximum brightness.
This has consequences for what we obsereve in a giant eruption. The thermalization depth usually occurs at Thomson scattering depths τsc ∼ 2 or 3, a consequence of the opacity dependences. Emission lines are formed in the diffuse outflow outside that radius, i.e. in regions where τsc ∼ 1 to 2. This is the range where Thomson-scattered line wings are apparent, recognizable, and moderate – just like the spectra of the best-observed giant eruptions. Thus, when we observe Thomson-scattering wings on the Balmer emission lines, with a visual continuum slope like T ∼ 7000 to 10000 K, then this is a stellar wind, a super-Eddington flow.
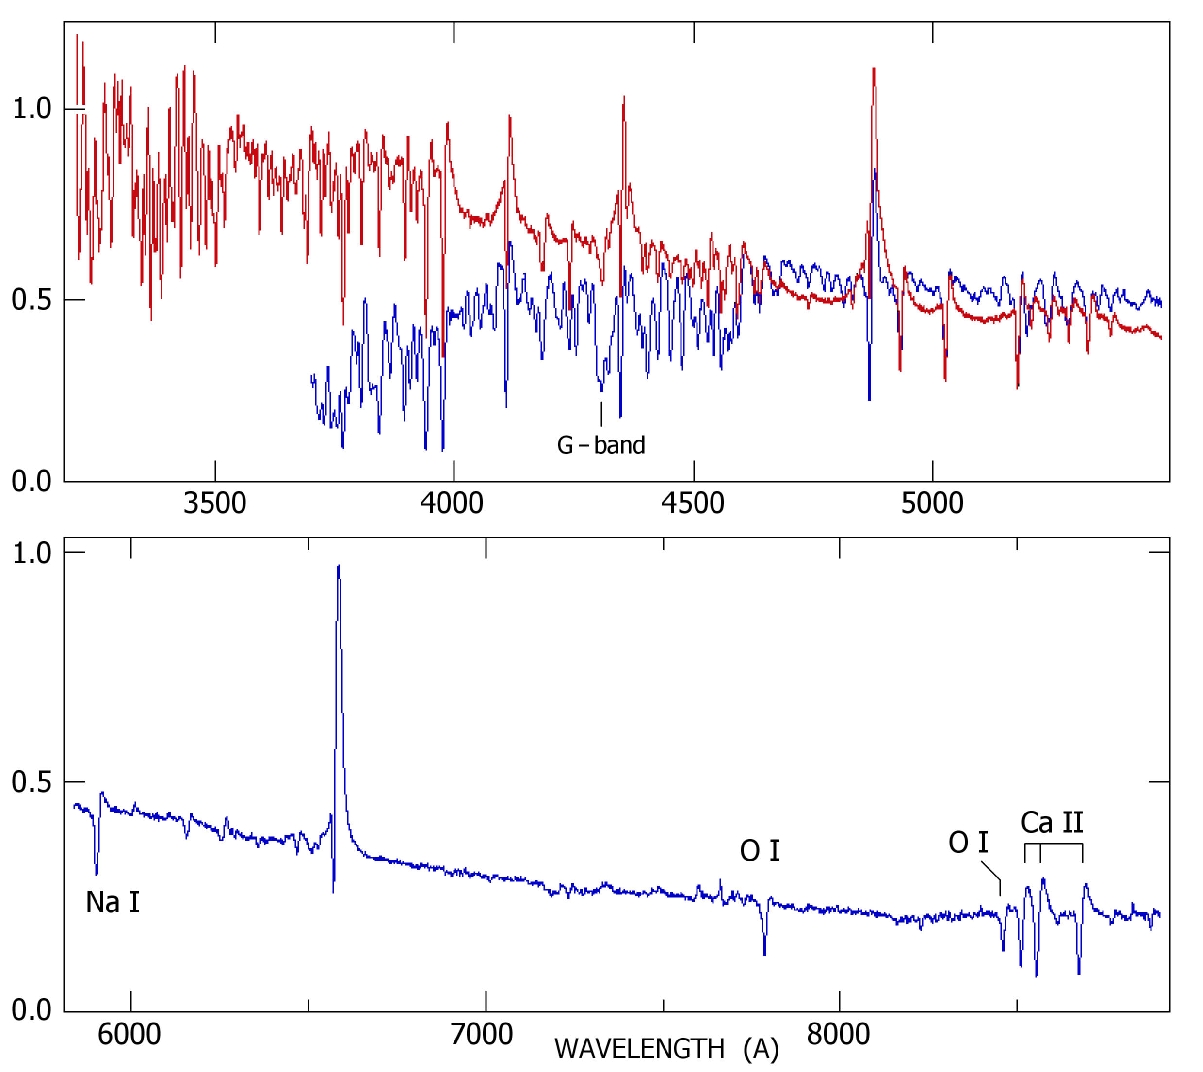
For example Figure 3 shows the evolution the spectrum of SN2011ht []. The Thompson/electron scattering profiles on the Balmer lines are prominent. The outflow velocity was 600 km/s and the total energy in the eruption was only 2 x 1049 ergs. Was it an imposter or SN?
 Nov. 2011
 Dec2011/Jan2012