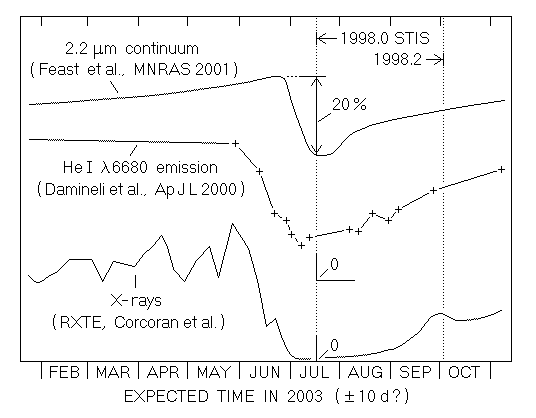

This figure, constructed in August 2001, shows when the 2003 spectroscopic event should occur if it repeats the behavior of 1997-98. These plots represent ground-based and RXTE data obtained then, shifted forward by 2023 days = 5.54 years. In fact we didn't expect an exact recurrence, but these are the best predictions that were available before June 2003.
The ground-based observations represent an unresolved mixture of the stellar wind plus ejecta farther out; until HST/STIS data are obtained we can't tell exactly where the changes occurred nor what they were. Two faint vertical lines indicate phases in the cycle when the earliest HST/STIS observations were made. The first of them included only a minimal sample of wavelengths, six weeks after the event began.